



The Number at the Gate
Renewables really are the cheapest new power to build. Lazard says so, and it is true. But the number measures one thing honestly, the cost of building the plant, and leaves out at least two more: what it costs to make that power reliable, and what it costs to clean up the ground when the panels are spent.
Every few months a report lands that settles an argument for people who never read it. This July it was Lazard’s, the investment bank whose annual cost-of-energy study has become the most quoted number in American power policy. The headline wrote itself: renewables remain the cheapest form of new electricity to build. It is true. It is also one of the most misunderstood true things in the entire energy debate, and the misunderstanding is not an accident. It is the product being sold.
The number gets waved around in every direction. Developers use it to argue a solar farm is self-evidently necessary. Utilities use it to justify what they build. State agencies use it to reassure the public that the cheapest thing is also the best thing. Almost none of them explain what the number measures, because the explanation is where the argument stops being simple.
What the number actually measures
The number is called the levelized cost of energy, or LCOE. Strip the jargon and it is an average. You take everything a power plant costs across its whole life: the steel and panels and wiring to build it, the money borrowed to finance it, the crews to run it, the fuel it burns, and the bill to tear it down. You add all of that up. Then you divide it by every unit of electricity the plant will produce over its lifetime. What comes out is one price per unit, spread flat across thirty years. That flattening is the “levelizing,” and it exists for one honest reason: to compare things that cost money in completely different shapes.
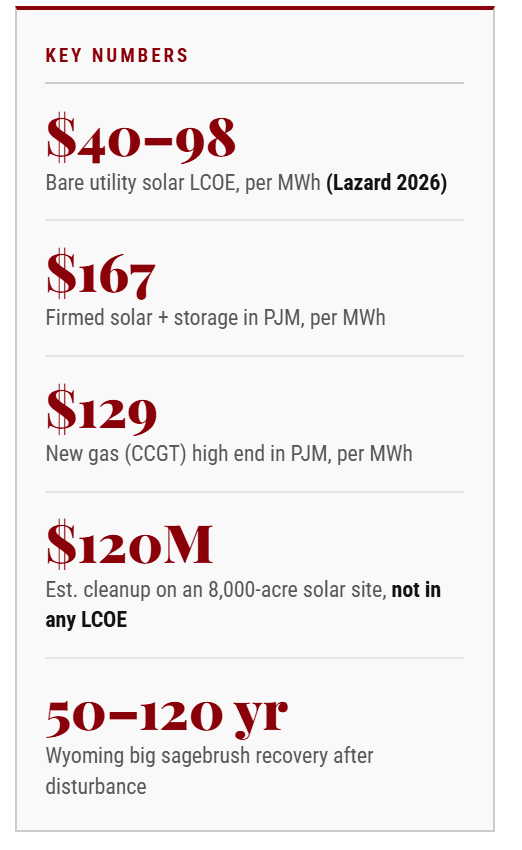
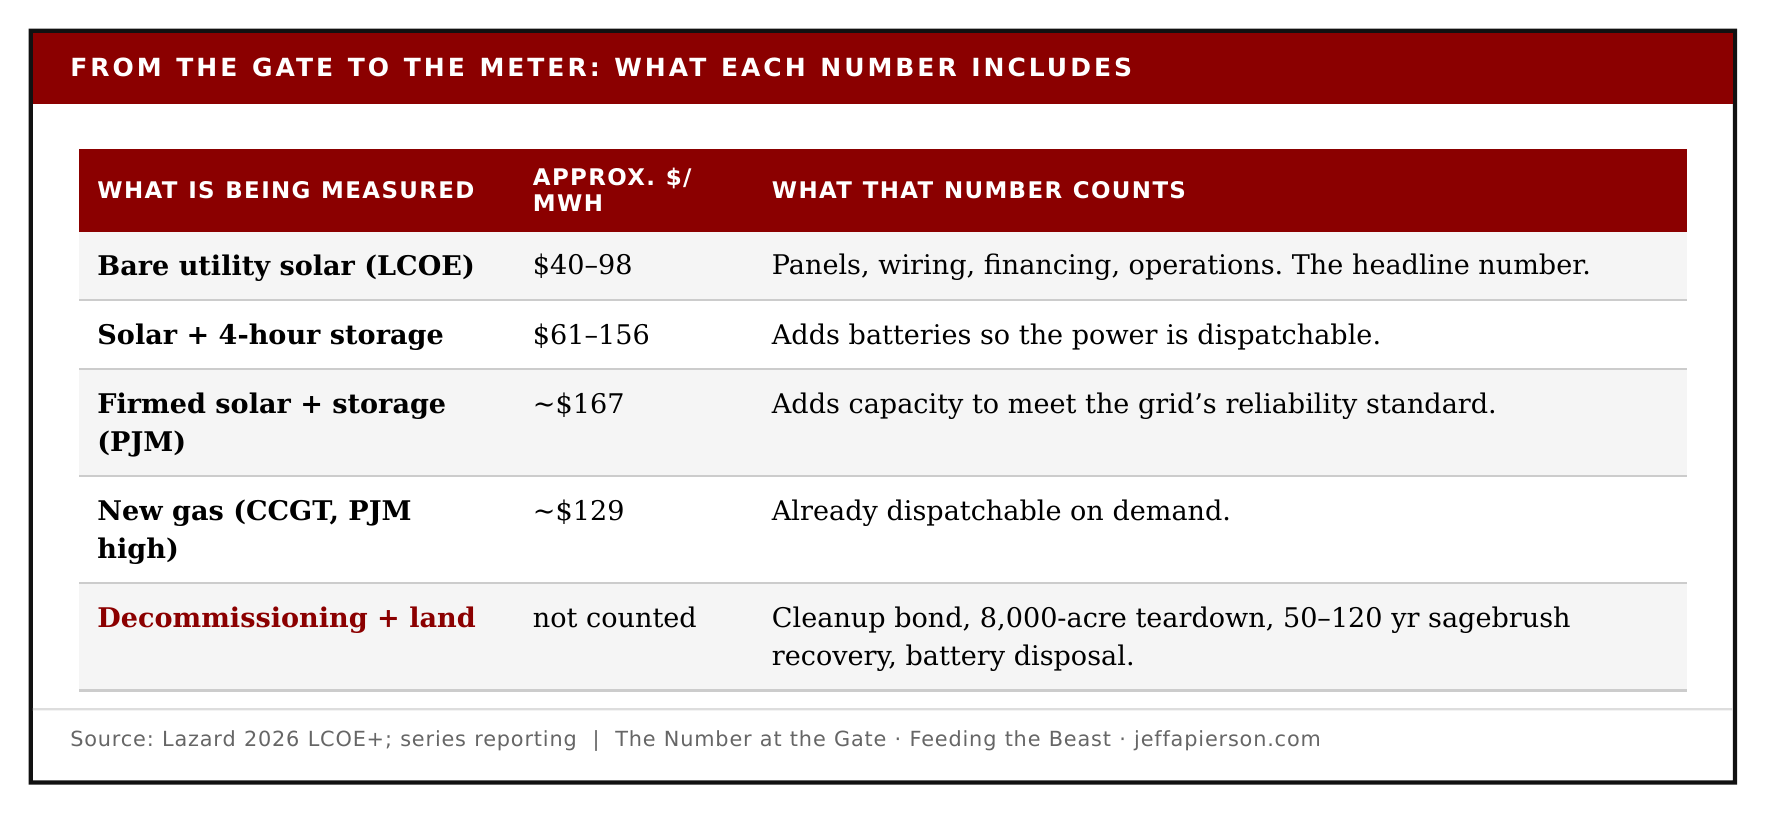
A solar farm is almost all up front. You spend the money once, and the sunlight after that is free. A gas plant is the reverse, cheaper to build but buying fuel every hour it runs. Levelizing turns both into a single figure so you can lay them side by side. On that measure, this year, Lazard puts new utility-scale solar at roughly $40 to $98 per megawatt-hour and new onshore wind at about $37 to $99, both still under new gas, coal, and nuclear.[1] The claim is real. Believe it
The price at the gate is not the price at the meter
Here is what the number does not tell you, and it is the whole game. Levelized cost measures the price of electricity at the factory gate. It does not measure the price of electricity delivered to you, at the moment you actually need it.
You do not consume electricity on average. You consume it at a specific instant, on the coldest evening of the year, when the sun is down and the wind is still and every furnace in the valley is pulling at once. That is the moment the grid has to meet. A solar panel priced cheaply across a sunny year is worth nothing at that instant. To turn cheap-on-average power into power-on-demand, you have to add something: batteries to hold the daytime surplus, or a gas plant idling in reserve, or both. Somebody builds that. Somebody pays for it. And it is not in the headline number.
The bank prints the correction itself
To Lazard’s credit, it now publishes the correction in the same report, on a later page nobody quotes. It is called the cost of firming intermittency, and it is the honest attempt to answer the delivered-power question: what does it cost once you add enough storage and backup to make the renewable reliable on a real grid?
The answer moves the picture. Solar paired with four hours of batteries already runs higher than bare solar, around $61 to $156 a megawatt-hour, because now you are paying for the batteries too.[2] Then add the firming, the extra capacity needed to meet the grid’s reliability standard, and firmed solar-plus-storage comes out near $115 in California, about $150 in Texas, and roughly $167 in the mid-Atlantic grid called PJM. In that same market a new gas plant runs about $129 at the high end.[3] Read that twice. Once you pay for reliability, the cheapest thing to build can cost more than the gas plant it was supposed to beat.
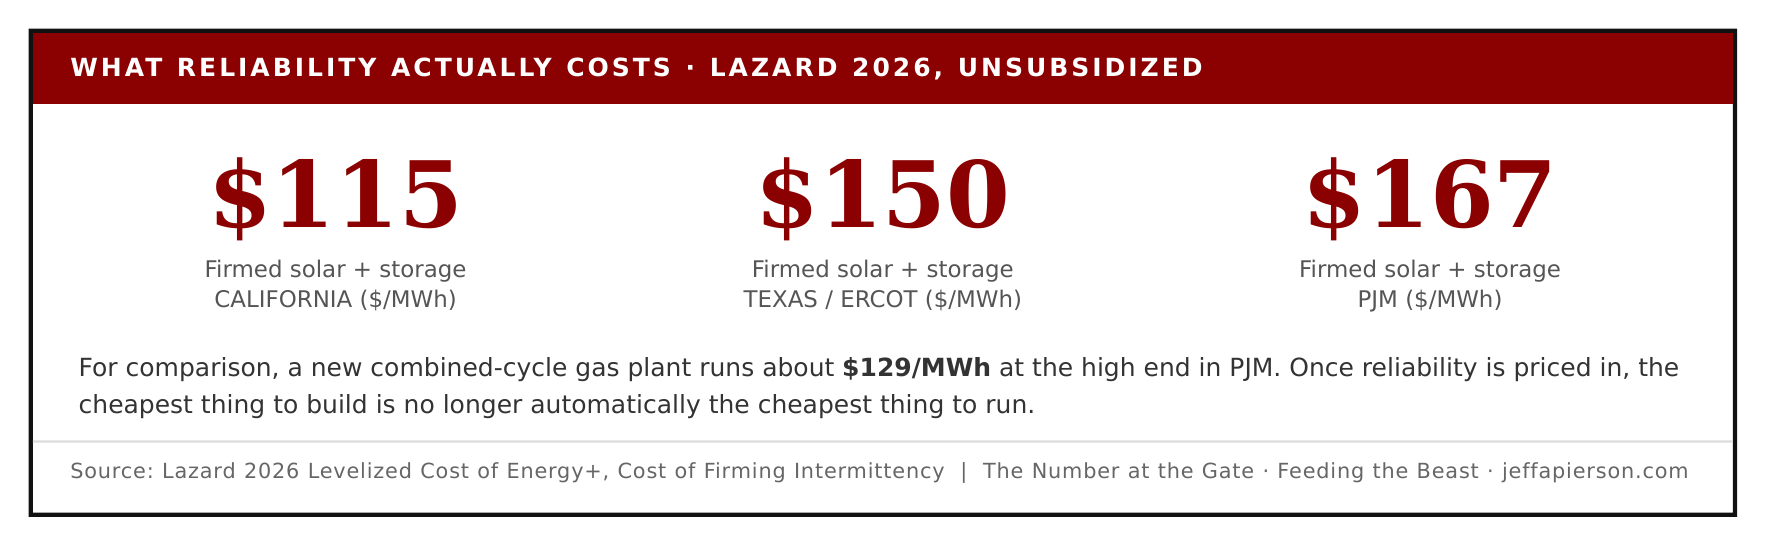
For comparison, a new combined-cycle gas plant runs about $129/MWh at the high end in PJM. Lazard 2026 LCOE+, unsubsidized. Once reliability is priced in, the cheapest thing to build is no longer automatically the cheapest thing to run.
And storage got more expensive this year, not less, reversing a long decline, because new tariffs on imported lithium-ion batteries and rules cutting off cheap Chinese cells pushed the price back up.[4] The technology that was supposed to make intermittency free is moving the wrong way on cost.
There is a second trap in the firming math. The more solar you add to a grid, the less each additional panel is worth for reliability, because they all fade at the same hour, at sundown.
There is a second trap in the firming math. The more solar you add to a grid, the less each additional panel is worth for reliability, because they all fade at the same hour, at sundown. The first solar farm firms cheaply. The tenth one has to buy proportionally more backup to count for the same reliability. So the cost of firming does not stay flat as you build more. It climbs.[5]
Why every cost claim deserves a second question
Lazard says plainly, in its own footnotes, that even its firming number is not the total system cost of delivering one reliable megawatt-hour. It does not include the transmission lines to move remote wind and solar to the cities that burn it. It does not include the years a project waits in the interconnection queue. It does not include the power thrown away, curtailed, when too much arrives at once.[6] The most careful cost study in the business tells you, if you read to the end, that it is not measuring the thing most people cite it to prove.
That is why a cost claim from a utility or a state agency is the beginning of a question, not the end of one. When Idaho Power or the Commerce Department or a project developer calls a thing “cheap,” the ratepayer’s job is to ask the three questions the headline skips. Cheap to build, or cheap to deliver? Cheap at the gate, or cheap at your meter on the worst night of the year? And cheap over what span, the thirty years it runs, or the century the land carries the consequence?
The bill that outlives the panels
That last question opens the cost that not even the firming number touches, and it is the one this series keeps returning to. Every figure above, the plant-gate price, the storage, the firming, all of it stops counting on the day the project is switched off. None of it prices what happens next.
When the panels are spent, in about thirty years,[7] someone has to take down thousands of acres of steel and glass and haul it away. Published estimates run around $15,000 an acre.[8] On an 8,000-acre site, the kind now being floated in the Magic Valley, that is roughly $120 million in cleanup,[9] on ground that by then earns nothing. The only thing standing between that bill and the county is a decommissioning bond, and only if it is fully funded, indexed to inflation, and held somewhere the developer cannot reach it. Projects change hands and go broke over thirty years. When the bond comes up short, the cost lands on the landowner, and behind him, the public.
When the panels are spent, in about thirty years, someone has to take down thousands of acres of steel and glass and haul it away. Published estimates run around $15,000 an acre
Then there is the ground itself, the cost with the longest tail of all. You cannot grade the desert, road it, drive thousands of steel piers into it, and shade the soil for three decades, then flip it back to sagebrush like a switch. Big sagebrush needs at least thirty years just to stabilize, and one study of Wyoming big sagebrush on disturbed ground put full recovery of cover at closer to ninety years. For Wyoming big sagebrush, the winter range that feeds mule deer and pronghorn, published recovery estimates run 50 to 120 years, and longer on the poorest sites.[10] And in this cheatgrass country, if the reseeding fails, you do not get sagebrush back at all. You get an invasive grassland that burns hotter and more often than what stood there before. None of that is a line item in any levelized cost. It is simply left off the page.
The batteries carry their own tail. A grid-scale storage site is thousands of lithium cells with a real fire risk and a disposal problem the recycling industry has not solved at scale.[11] That cost, too, arrives decades after the study was filed and forgotten.
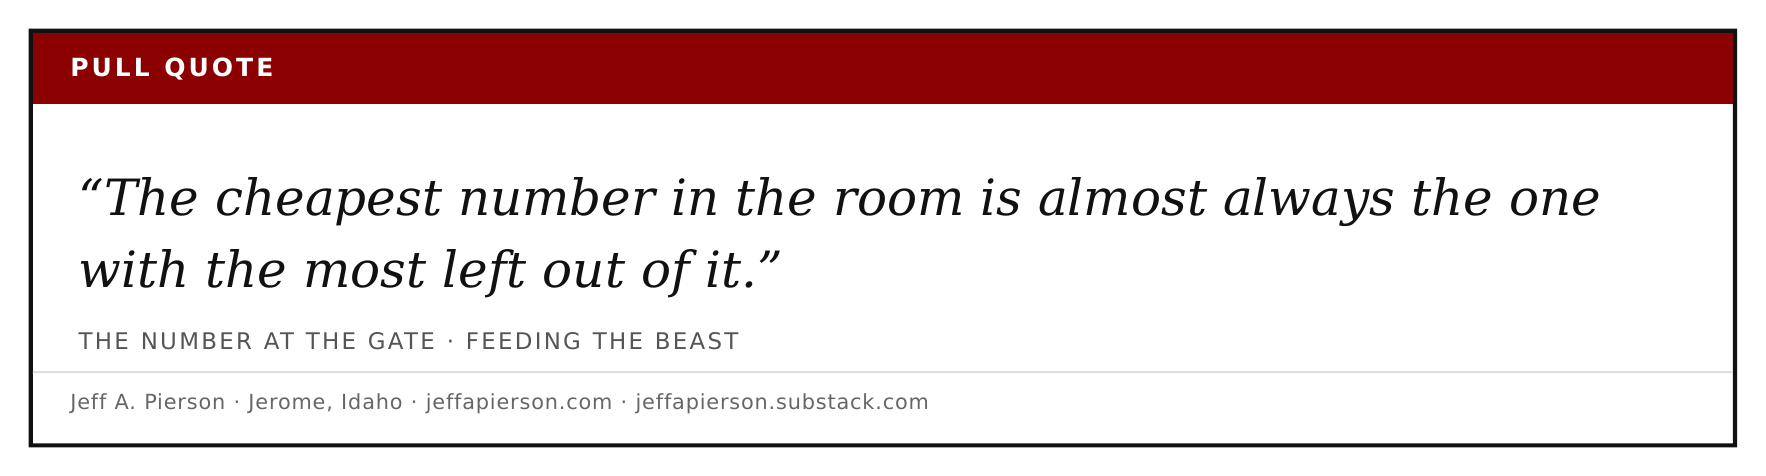
The cheapest number in the room is almost always the one with the most left out of it.The Number at the Gate · Feeding the Beast
The point is the accounting, not the technology
None of this makes renewable power bad. Fossil plants carry their own uncounted tails, the emissions, the ash ponds, the fuel bought forever. The point is not that solar is secretly worse than gas. The point is that the single number everyone repeats was never built to settle the question everyone uses it to settle. It measures the cost of making electricity, cheaply and honestly, at the factory gate. It does not measure the cost of delivering reliable power to a real house on a real grid, and it does not measure the cost of the ground and the steel and the cells for the sixty to a hundred years after the power stops flowing.
So when the next report lands and settles the argument for people who did not read it, do the thing they are counting on you not to do. Read past the headline. Ask what the number measured and what it left off. Ask who pays for the reliability, and who pays for the cleanup, and when. The cheapest number in the room is almost always the one with the most left out of it. In Idaho, the part left out has a way of landing right here, on the county, on the aquifer, on the ground, long after the people who quoted the number have moved on to the next one.
Questions worth pressing
When Idaho Power, the Commerce Department, or a developer calls a project “cheap,” are they citing the plant-gate levelized cost or the firmed, delivered cost that includes storage and backup? The answer should be on the record before any approval.
For a proposed solar or battery project, is the decommissioning bond fully funded, indexed to inflation, held beyond the developer’s reach, and sized to the real teardown cost rather than the $10,000-per-acre federal floor?
At Idaho Power’s current solar penetration, what does firming one more megawatt-hour of solar actually cost on this system, and does the project pay that cost or does it fall on ratepayers?
Does the cost comparison used to justify a project include transmission, interconnection-queue time, and curtailment, or only the headline levelized cost?
For a grid-scale battery site, who is liable for fire response and for recycling or disposing of the cells decades from now, and is that liability bonded up front?
Glossary
Levelized cost of energy (LCOE). The lifetime cost of a power plant divided by all the electricity it will ever produce, stated as one price per megawatt-hour. It measures the cost of building and running the plant, not the cost of delivering power on demand.
Levelizing. Averaging a plant’s up-front and ongoing costs into a single per-unit price, so plants with very different cost shapes (a solar farm paid for once, a gas plant buying fuel forever) can be compared side by side.
Megawatt-hour (MWh). A unit of electricity: one megawatt of power delivered for one hour, roughly the monthly electricity use of about thirty average homes.
Firming / cost of firming intermittency. The added cost of making an intermittent source such as solar or wind reliable enough to meet demand at any hour, by adding storage and backup. Lazard reports it separately from LCOE.
Dispatchable. Able to deliver power on command, at the moment it is needed, rather than only when the sun shines or the wind blows.
Effective load carrying capability (ELCC). How much a resource can be counted on for reliability. It falls as more of the same resource is added, because they all produce, and fade, at the same hours.
Curtailment. Electricity that is generated but thrown away because the grid cannot use or move it at that moment.
Interconnection queue. The waiting line of projects seeking permission to connect to the grid, often a multi-year delay and cost not captured in LCOE.
Decommissioning bond. Money a developer sets aside up front to guarantee a project is dismantled and the site restored at end of life, so the cost does not fall on the landowner or county.
CAISO / ERCOT / PJM. The grid operators for California, most of Texas, and the mid-Atlantic region. Firming costs differ by region because each grid has different reliability rules and resources.
A note on the calculations
Two of the figures in this article are arithmetic, not direct quotations from a source, so the steps are set out here in full.
The roughly $120 million cleanup figure is 8,000 acres times about $15,000 per acre. The 8,000 acres is the size of the Magic Valley solar scenario this series has used from the start. The $15,000 per acre is the median utility-scale decommissioning cost from a 2026 review of 21 projects with public teardown plans (note 8).
The $80 million figure is a lower-bound check on the same site: 8,000 acres times $10,000 per acre, the BLM financial-assurance floor for solar on federal land (note 9). It is the smallest bond a county should accept, not an estimate of the real cost. Both are round-number planning estimates; a specific proposal’s true cost would depend on its panel count, its salvage credit for scrap steel, aluminum, and glass, and the condition of the site, and should be recalculated against those before republication.
Notes and Sources
1 Lazard, 2026 Levelized Cost of Energy+ (LCOE+), Version 19.0, released July 13, 2026 (19th edition). Unsubsidized utility-scale solar about $40 to $98/MWh, up roughly 18 percent year over year; onshore wind about $37 to $99/MWh; renewables remain the lowest-cost new-build generation despite rising costs. Primary: Lazard press release and LCOE+ report, lazard.com. Corroborating: pv-magazine-usa.com; BigGo Finance; OilPrice.com (July 2026).
2 Utility-scale solar paired with four-hour storage about $61 to $156/MWh, reflecting added investment for dispatchability and firming. Primary: Lazard 2026 LCOE+ (firming appendix), lazard.com. Corroborating: pv-magazine-usa.com (July 13, 2026).
3 Lazard 2026 LCOE+, Cost of Firming Intermittency: firmed solar-plus-storage about $115 (California/CAISO), $150 (Texas/ERCOT), and $167 (PJM) per MWh; new combined-cycle gas about $129/MWh at the high end in PJM, all unsubsidized. Primary: Lazard 2026 LCOE+ report, lazard.com. Corroborating: Heatmap News; gas $51 to $129/MWh per BigGo Finance (July 2026).
4 Battery storage costs rose over the past year, driven by tariffs on imported lithium-ion batteries and Foreign Entity of Concern (FEOC) restrictions shifting supply chains away from China. Primary: Lazard 2026 LCOE+ press release, lazard.com. Corroborating: OilPrice.com and BigGo Finance; on rising firming costs, Latitude Media and Heatmap News.
5 Effective load carrying capability (ELCC) for renewables declines as penetration rises; CAISO and PJM have cut accreditation values for correlated resources such as solar and short-duration storage. Primary: Lazard 2026 LCOE+ (ELCC data as of May 2026), lazard.com. Corroborating: Latitude Media.
6 Lazard cautions that the firming figure is not the total system cost of one incremental reliable megawatt-hour and excludes transmission, interconnection-queue, and curtailment costs, recommending LCOE be treated as a starting point. Primary: Lazard 2026 LCOE+ report, lazard.com. Corroborating: Heatmap News (July 2026).
7 Utility-scale solar panels have an expected operating life of about 30 years, after which output has degraded enough that the site is repowered or decommissioned. Primary: Stocks & Weber (Pitt GSPIA / Georgia College & State University, 2026), noting an expected life of around 30 years. The roughly 30-year design life is the standard assumption in utility-scale PV cost modeling (NREL) and decommissioning studies (NYSERDA, 2020).
8 Utility-scale solar decommissioning about $15,000 per acre (2024 dollars), from a review of 21 projects with public decommissioning plans. Primary: Stocks & Weber, “What will it cost to decommission solar farms?” (Pitt GSPIA / Georgia College & State University, 2026). Underlying data: Maryland Department of Natural Resources and University of Michigan School for Environment and Sustainability studies.
9 The roughly $120 million figure is an author’s calculation: about 8,000 acres (the series’ Magic Valley scenario) times about $15,000 per acre. For scale, the BLM financial-assurance floor for solar on federal land is $10,000 per acre, which would still require about an $80 million bond on the same site (43 C.F.R.). Primary: NREL, “A Survey of Federal and State-Level Solar Decommissioning Policies” (NREL/TP-6A20-79650, 2022). Corroborating: Okon Recycling (2025).
10 Big sagebrush needs at least three decades to stabilize after disturbance, and Wyoming big sagebrush cover has been estimated to take about 87 years to recover naturally on disturbed ground. Primary: Avirmed et al., “Sagebrush steppe recovery on 30-90-year-old abandoned oil and gas wells,” Ecosphere (2015). Corroborating: USFS Fire Effects Information System review (full recovery not reached within 66 years; late-successional canopy about 78 to 83 years) and USFS fire-regime synthesis (40 to 80 years, up to 100 to 200 on unproductive sites). Series’ original citations for the 50 to 120 year framing: Shinneman & McIlroy; Baker.
11 Fire safety and end-of-life recycling are identified in the peer-reviewed literature as the central challenges to scaling grid lithium-ion storage. Primary: Huang et al., “Key Challenges for Grid-Scale Lithium-Ion Battery Energy Storage,” Advanced Energy Materials (2022); “Battery Hazards for Large Energy Storage Systems,” ACS Energy Letters. Corroborating: industry analyses estimate only about 10 percent of end-of-life lithium-ion batteries are currently recycled (Electrical Trader, 2026).